

Why NFL Betting Statistics Matter More Than Gut Feeling
Three years ago, I watched a mate blow through his entire NFL season bankroll in Week 4. He had "a feeling" about a Thursday night parlay. No data, no ATS history, no understanding of how the line had moved overnight — just vibes. His five-leg accumulator crashed on the second game. When I asked him what the public betting splits looked like before kickoff, he stared at me like I was speaking Klingon.
That moment crystallised something I had been seeing across nine years of tracking NFL wagering markets: the gap between bettors who use statistics and bettors who rely on instinct is not a gentle slope. It is a cliff. Americans wagered roughly $30 billion on the NFL during the 2025 season alone through legal sportsbooks, an 8.5% jump from the previous year. Globally, the sports betting market crossed the $100.9 billion valuation mark in 2024, with projections pointing toward $258 billion by 2033. That volume of money does not move on gut feelings. It moves on data — spread records, totals trends, handle distribution, sharp-money signals, and the kind of granular situational splits that separate recreational punters from professionals.
This page is the resource I wish existed when I started modelling NFL outcomes from a flat in East London. Every statistic, every trend, every market insight gathered here comes from primary sources: gaming commission filings, SEC disclosures, league data partners, and the UK Gambling Commission itself. Whether you are placing your first handicap wager on a London Game or refining a same-game-parlay strategy you have been running for years, the numbers on this page will ground every decision you make this season. No hunches. No tipster hype. Just the data.
The Numbers Behind Every NFL Wager
- Americans wagered $30 billion on the NFL in the 2025 season through legal sportsbooks — a market so deep that the resulting lines are among the most efficiently priced in all of sports.
- Underdogs finished 2025 with an 89-69-4 ATS record (56.3% cover rate), while home teams covered just 43% of the time — continuing the erosion of traditional home-field advantage.
- Parlay win rates drop steeply with each added leg: roughly 50% for two legs, below 30% for three, below 15% for four. The bookmaker margin compounds with every selection.
- UK NFL betting is growing faster than any other American-sport vertical in Britain: 65% more bettors, 60% more bets, and a 90% surge in player prop stakes year-on-year.
- Super Bowl LIX generated $1.76 billion in legal US handle alone — a single-game record that underscores the NFL's dominance as the world's most bet-on annual sporting event.
NFL Betting Market in Numbers: Handle, Revenue, Growth
I remember the first time I saw a state-level handle report that made me physically sit up in my chair. It was a New Jersey gaming commission filing, circa 2019, and the NFL numbers already dwarfed everything else on the page. Fast forward to today and the scale of NFL wagering has become genuinely difficult to comprehend — not just for Americans, but for anyone in the UK who wants to understand the market they are betting into.
$30 Billion
Approximate legal handle on the NFL 2025 season in the US — up 8.5% year-on-year.
$165.58 Billion
Total legal US sports wagering in 2025, generating $16.80 billion in gross gaming revenue at a 10.15% hold rate.
48%
Europe's share of the global sports betting market in 2024 — the largest regional slice on earth.
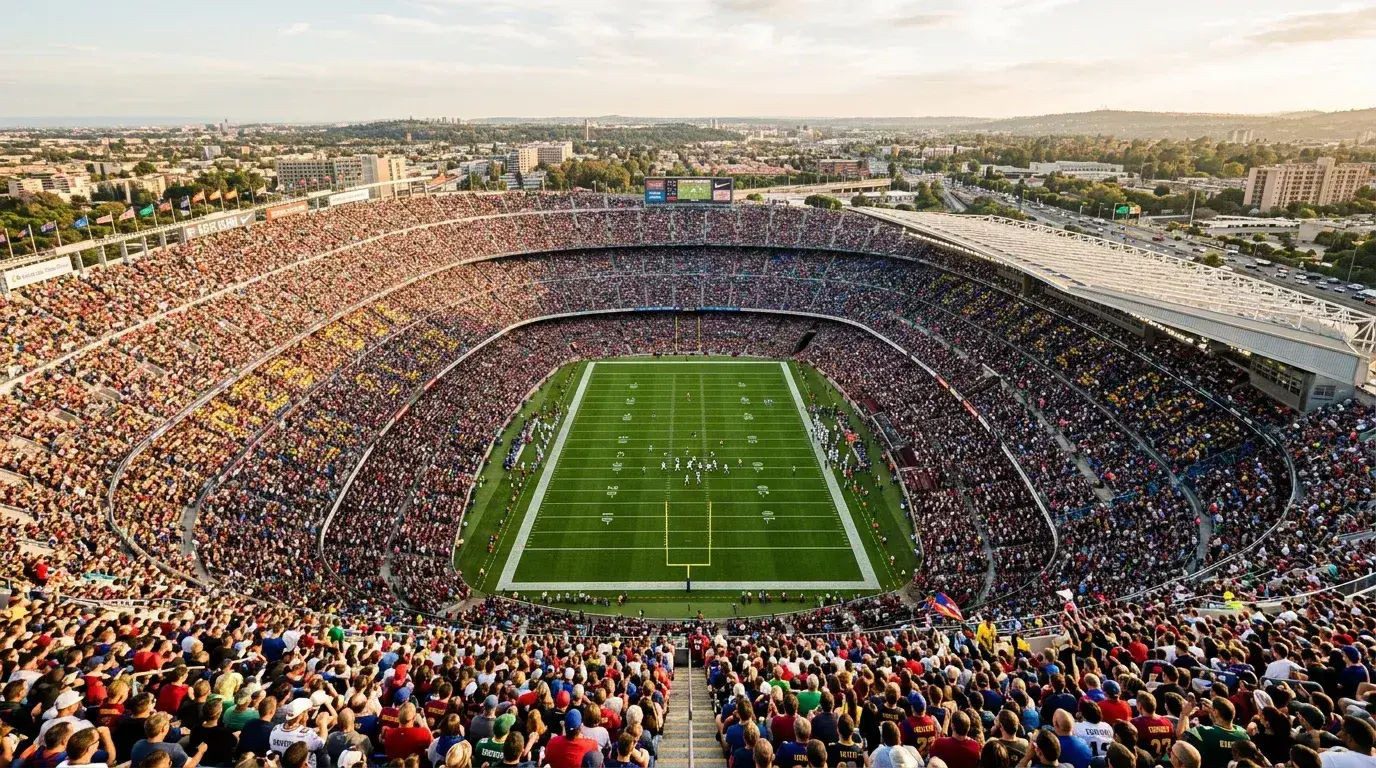
Those numbers deserve unpacking. The $30 billion NFL figure represents legal, regulated wagers only. It does not include offshore books, unregulated prediction markets, or peer-to-peer bets — all of which remain substantial. The NFL's dominance within the US sports betting ecosystem is staggering: a single Sunday afternoon window routinely generates more handle than an entire week of MLB or NBA action combined. No other sport comes close in terms of concentrated wagering volume over a short calendar.
For UK bettors, this matters more than you might think. The odds you see on your sportsbook app for an NFL spread or total are downstream products of this colossal American market. When $30 billion flows through legal US books in a season, the resulting line efficiency — how precisely the spread reflects the true probability of an outcome — is extremely high. That means finding value in NFL markets requires sharper analysis than it does in, say, League Two football or darts. The market is deep, liquid, and relentlessly priced.
Bill Miller, president and CEO of the American Gaming Association, framed the 2025 season as a moment where "fans have more ways than ever to responsibly engage with the game they love," calling legal sports betting an enhancement to "the fun and friendly competition that make NFL games and traditions even more special." That is the industry line. The data underneath it tells a more nuanced story: a market growing fast, but one where the bookmaker's structural edge — that 10.15% hold rate across all sports — ensures the house wins in aggregate.
A single NFL regular-season Sunday generates more betting handle in the United States than an entire week of Major League Baseball or NBA games. The NFL is not just the most popular sport for American bettors — it is the most popular sport by a margin that makes the comparison almost unfair.
The global picture reinforces the NFL's gravity. The worldwide sports betting market hit $100.9 billion in 2024, and growth projections suggest $258 billion by 2033 at an 11% compound annual rate. Europe accounts for 48% of that global market, with the UK alone holding roughly 11% of the worldwide share. If you are betting on the NFL from Britain, you are operating in one of the most mature, regulated, and competitive gambling markets on the planet — and you are wagering on the single most heavily bet sporting event cycle in existence. That combination demands a data-driven approach, not a casual one.
Against the Spread: What the League-Wide ATS Data Shows
If I could teach every new NFL bettor in Britain one concept before they placed a single wager, it would be ATS — against the spread. Not because it is complicated, but because it unlocks a completely different way of reading results. A team can win every game and still be a terrible bet. A team can lose twelve games and still make you money. The spread is the great equaliser, and the ATS record is the scoreboard that actually matters for bettors.
ATS stands for "against the spread." In UK terms, it is equivalent to handicap betting. When you see that a team went 10-6 ATS, it means they covered the bookmaker's point spread in ten of their sixteen games — regardless of whether they won or lost outright. This is the single most important record for spread bettors to track.
The 2025 NFL season delivered one of the most dramatic ATS stories in recent memory. Underdogs finished the regular season with an 89-69-4 record against the spread — a cover rate above 56%. Home teams, meanwhile, stumbled to a dismal 68-90-4 ATS mark, covering barely 43% of the time. If you had blindly backed every road underdog last season, you would have had a profitable year without watching a single snap of football. That is not a strategy I recommend — blind angles are fragile — but the data illustrates how profoundly the spread landscape shifted.
Here is the wrinkle that confused a lot of people: the 2024/25 season also produced the highest rate of outright favourite wins in nearly twenty years. How can underdogs dominate ATS while favourites win more games? Because the spread and the moneyline measure different things. Favourites won games, yes — but they won by fewer points than the line implied. A team favoured by 7 that wins by 4 is a moneyline winner and an ATS loser simultaneously. That distinction between outright victory and spread coverage is the single most important concept for UK bettors transitioning from match-result markets to handicap wagering.
Underdogs ATS 2025
Record: 89-69-4
Cover rate: 56.3%
Profitable on a flat-bet basis for the full season.
Home Teams ATS 2025
Record: 68-90-4
Cover rate: 43.0%
Worst home ATS showing in several seasons, continuing a post-COVID trend of eroding home-field edge.
For UK bettors placing handicap wagers, these numbers translate directly. When your sportsbook offers Kansas City Chiefs -6.5 and you back the opposition at +6.5, you are making an ATS bet in all but name. The historical data on NFL ATS records stretching back two decades reveals persistent patterns: underdogs consistently cover at rates that hover around or above 50%, while home-field advantage — once worth a reliable 3 points in the spread — has eroded significantly since 2020. Understanding where the spread tilts and why is the foundation of every other betting analysis on this page.
Key Numbers Every NFL Spread Bettor Should Know
There is a reason experienced NFL bettors obsess over certain numbers when they look at a spread. In American football, scoring happens in increments — three points for a field goal, seven for a touchdown with a successful extra point, six for a touchdown without one. Those increments create clusters in the final margin of victory, and those clusters are what the industry calls "key numbers."
The most important key number is 3. More NFL games are decided by exactly three points than any other margin. The second most common margin is 7. After that, 10 (a field goal plus a touchdown) and 6 show up with meaningful frequency. When you see a spread sitting at -3 or -7, you are looking at a line planted on a key number, and the difference between getting +3 and +2.5, or -7 and -7.5, can be the difference between a push and a loss over a full season of bets.
I will keep this brief here because the full statistical breakdown — how often games land on each key number, how half-point line moves around 3 and 7 affect long-term results, and why buying points across key numbers can shift expected value — deserves its own deep dive. For now, the takeaway is simple: if you are betting NFL spreads and you are not paying attention to whether a line sits on, above, or below a key number, you are leaving value on the table every single week.
Over/Under Totals: League-Wide Scoring Trends
Scoring in the NFL does not stay constant. It breathes. Some seasons average 44 combined points per game, others push past 46, and then the league tinkers with a rule or defensive coordinators catch up with an offensive trend and the numbers dip again. If you bet totals — overs and unders — without tracking these cycles, you are essentially flipping a coin with a small built-in fee for the bookmaker.
Scoring Cycles
League-wide points per game fluctuate by 2-3 points across eras, driven by rule changes, offensive innovation, and defensive adaptation.
Line Clustering
Most NFL totals lines sit between 41.5 and 48.5. Games with totals above 51 or below 38 are rare and attract disproportionate sharp attention.
Situational Splits
Weather, venue type (dome vs outdoor), and primetime scheduling all produce measurable shifts in scoring averages.
The 2025 season offered a useful case study. Underdogs covered the spread at above-average rates, as discussed, but the totals landscape was equally interesting. The NFL's International Series — particularly the London games, which drew record UK audiences in 2025 — provided a natural experiment in situational totals analysis. London games are played on neutral turf, often with unfamiliar travel schedules, and historically they produce scoring patterns that deviate from the season average. Whether they skew over or under depends on the matchup, but the deviation itself is a data point worth tracking.
For UK bettors, totals markets often feel more intuitive than spreads. You do not need to pick a winner or figure out a handicap — you just need to decide whether the combined score will clear a number. That simplicity is appealing, but it masks real complexity underneath. Weather conditions at outdoor stadiums, short-week scheduling on Thursday nights, and the difference between dome and open-air venues all influence scoring in ways that the line does not always fully price. The full breakdown of NFL over/under stats digs into the historical splits, team-level trends, and the specific conditions that create edges in the totals market.
One thing I have learned tracking totals for nearly a decade: the public overwhelmingly bets overs. People want to watch points. They want action on every drive. That bias is real, it is measurable, and sportsbooks know it — which is why under results have historically offered thin but persistent value across large sample sizes. Not every season, not every matchup, but over time. The numbers do not lie about where the crowd leans.
Parlay and Accumulator Win Rates: What the Data Actually Says
Let me tell you the most expensive lesson in sports betting, and it will cost you nothing to learn it here: parlays are where sportsbooks make their money. Not on sides. Not on totals. On the multi-leg accumulators that every bettor loves and that the mathematics relentlessly punish. I say this as someone who has built parlay models, tracked SGP hit rates across three full seasons, and watched the data confirm the same conclusion every single year.
The 2024/25 NFL season was a rare exception to the rule that parlays favour the house. Flutter Entertainment reported that the season's unusually high rate of favourite wins, the highest in nearly two decades, caused same-game parlay and standard parlay outcomes to swing dramatically in bettors' favour. Sportsbook margins on parlay products were crushed. It was the most "customer friendly" NFL season since online sports betting launched in the US. That result was an outlier — and the bookmakers know it.
The underlying win-rate mathematics have not changed. A two-leg NFL parlay has a win probability in the range of 49-52%, depending on leg selection. That sounds almost coinflip-fair, and for two legs it nearly is. But the probability curve drops fast. A three-leg parlay wins roughly 27-30% of the time. Four legs: around 15%. Five legs or more: below 10%. These are not pessimistic estimates — they are the observed rates across thousands of settled parlays, and they assume reasonably priced legs with standard vig.
Parlay Win Probability by Legs
| Number of Legs | Approximate Win Rate | Implied Payout Needed to Break Even |
|---|---|---|
| 2 | 49-52% | ~1.92x to 2.04x |
| 3 | 27-30% | ~3.33x to 3.70x |
| 4 | ~15% | ~6.67x |
| 5+ | Below 10% | ~10x+ |
These figures reflect observed outcomes from multi-season NFL data. Actual payouts offered by sportsbooks are typically lower than the true-odds equivalent, embedding additional margin on each added leg.

Same-game parlays deserve special scrutiny because they contain correlated legs — outcomes within a single game that influence each other. If you back a team to win and also take the over on total points, those two events are not independent. Sportsbooks price SGPs using proprietary correlation models, and the margin built into each SGP is significantly higher than on a traditional parlay with uncorrelated legs from different games. The detailed probability breakdown and the hidden margin mechanics live in the NFL parlay statistics analysis.
For UK bettors, the parlay is marketed as the "accumulator" or "acca," and it is the bread and butter of casual weekend betting culture. I get the appeal. A small stake, a big potential payout, a reason to watch four games instead of one. But the data is unambiguous: every leg you add shifts expected value further in the sportsbook's favour. If you are going to bet accumulators, do it with your eyes wide open, a strict staking plan, and the understanding that these are high-variance, negative-expectation bets over any reasonable sample. Enjoy them for entertainment. Never mistake them for a strategy.
Data Validator
Public Money vs Sharp Money: Tracking Where the Handle Goes
Every Sunday morning during NFL season, I check the same two numbers before I check anything else: ticket percentage and handle percentage. They sound similar. They measure completely different things. And the gap between them is where the most actionable intelligence in NFL betting hides.
Ticket percentage — the proportion of individual bets placed on each side of a market. If 72% of tickets are on the Chiefs, seventy-two out of every hundred bets backed Kansas City. This reflects what the public — recreational bettors, casual punters, weekend warriors — believes will happen.
Handle percentage — the proportion of total money wagered on each side. If only 45% of handle is on the Chiefs despite 72% of tickets, it means the large-dollar bets — the sharp money, the professional wagers — are going the other way. This is the number that moves lines.
The divergence between these two metrics is the heartbeat of NFL market analysis. When the public loads up on one side but the money flows to the other, something is happening beneath the surface. Professional bettors, syndicates, and algorithm-driven operations tend to place fewer but larger wagers. Their bets carry disproportionate weight in the handle calculation, and sportsbooks adjust lines in response to that weight, not to the ticket count.
In 2025, the public finished the NFL regular season with a record of 145-140 ATS — a marginally winning season. That sounds like vindication for the crowd, but it obscures an important wrinkle: in games where 75% or more of the money landed on one side, the results were far less stable. Consensus picks — those lopsided games where nearly everyone agrees — are where the fade-the-public strategy finds its historical foothold. The logic is straightforward: when the entire market leans one direction, the line has already adjusted to absorb that weight, and the contrarian side often carries residual value.
I should be honest about the limits of this approach. Fading the public is not a magic system. It works in specific conditions — large sample sizes, heavily lopsided action, certain market types — and fails in others. The more useful skill is learning to read the split data as a diagnostic tool rather than a trading signal. When ticket percentage and handle percentage tell conflicting stories, dig into why. Is a key injury driving public sentiment while sharps have already priced it in? Is a primetime game attracting casual money that distorts the ticket count? Those questions, not the blind contrarian bet, are where the edge lives. The full framework for interpreting NFL public betting percentages — including historical sharp-versus-public performance data — unpacks this in detail.
Public Betting Characteristics
High ticket count, smaller average stakes. Gravitates toward favourites, overs, and primetime games. Sentiment-driven. Quick to react to headlines and recent results.
Sharp Betting Characteristics
Lower ticket count, larger average stakes. Data-driven. Moves lines. Targets inefficiencies early in the week. Less influenced by narrative or media coverage.
Super Bowl Betting: Handle Records and Global Reach
Nothing in sports betting compares to the Super Bowl. Not the Champions League final. Not the Grand National. Not the World Cup final. On a single Sunday in February, more money changes hands through legal sportsbooks than most sporting events generate across an entire tournament cycle. I have tracked Super Bowl handle data for the better part of a decade, and every year the number climbs higher — until this year, when the growth rate finally showed signs of plateauing.
Legal wagers on Super Bowl LIX in February 2025 came in at approximately $1.76 billion, smashing the previous record of $1.39 billion set by Super Bowl LVIII just a year earlier. That is a single game. One afternoon. $1.76 billion through regulated channels alone. Jeff Benson, director of sportsbook operations at Circa Sports, captured the sportsbook side of the equation after Super Bowl LX this year when he described it as "a helluva day, given our futures position" — the kind of understatement that only makes sense when you realise the scale of exposure bookmakers carry on this one event.
Projections for Super Bowl LX in 2026 estimated legal betting handle between $1.5 billion and $1.75 billion. The growth rate is decelerating compared to the explosive jumps of 2023-2025, suggesting the market may be approaching a near-term ceiling for single-event handle in the US — though global expansion, particularly in the UK and Europe, could extend the growth curve.
The Super Bowl is also a prop-bet bonanza. In the UK, where player prop markets like anytime touchdown scorer have surged in popularity, the Super Bowl concentrates more prop betting action into one game than the rest of the playoffs combined. The sheer variety — coin toss result, length of the national anthem, first scoring play type — turns the game into a carnival of markets, some analytical and some pure novelty. The detailed handle history, prop-bet volume data, and global wagering breakdown are covered in the Super Bowl betting statistics hub.
For UK bettors, the Super Bowl is often the entry point to NFL wagering. It is the one game that transcends the American sports calendar and lands in British pubs, living rooms, and office sweepstakes every February. What many casual Super Bowl bettors do not realise is how efficient the market becomes on this game. With $1.76 billion flowing through legal books and an unknown but substantial amount through offshore and international operators, the Super Bowl line is arguably the sharpest, most efficiently priced bet in all of sports. Finding value requires genuine preparation — and even then, the margin for error is razor-thin.
NFL Betting in the UK: A Market Growing at 65% a Year
I have been covering NFL betting markets from a UK perspective since before the London Games became an annual fixture, and the transformation in the British market over the last three years has been extraordinary. This is not a niche interest any more. The numbers tell a story of a fandom — and a betting market — that is growing faster than anyone in the industry anticipated.
65% Growth
Year-on-year increase in the number of UK and Irish bettors wagering on the NFL, reported by Entain for the 2024/25 season.
60% More Bets
Year-on-year increase in the total number of NFL bets placed through UK operators.
51% Staking Jump
Growth in staking volume specifically on NFL London Games compared to the 2023 series.
90% Prop Surge
Year-on-year growth in UK stakes on player props, particularly the anytime touchdown scorer market.
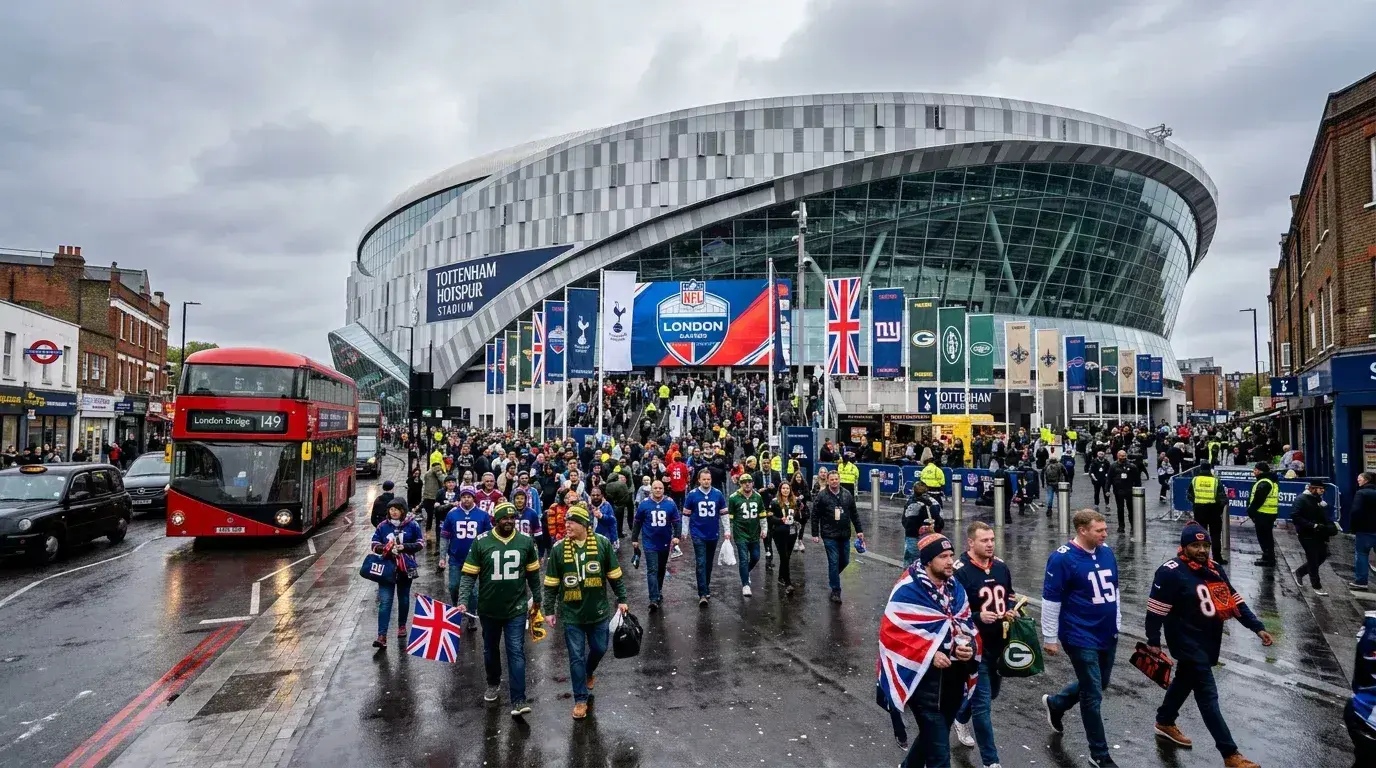
Greg Ferris, managing director for sports at Entain, put it plainly: "During the last twenty years, the NFL has become truly international, with games taking place around the world, helping to grow a global fanbase. In the UK and Ireland, fans are not only betting more on the games in London but also on many of the prime-time games being staged in the US. This is evidence of a committed and knowledgeable NFL fanbase in the UK that continues to grow." The emphasis on "knowledgeable" is worth noting. This is not just curiosity-driven dabbling — UK bettors are increasingly placing sophisticated wagers on player props, handicaps, and same-game parlays, not simply backing the team they have heard of.
The UK gambling market generated approximately £16.8 billion in gross gambling yield from remote betting in 2025, with 10% of the adult population engaging in online sports betting. Around 15% of men and 4% of women bet on sports. NFL betting, while still a fraction of football (soccer) volumes — which alone generate £1.1 billion in GGY — is the fastest-growing American-sport vertical in the British market.
The London Games have been the catalyst. The 2025 International Series broke viewership records, with an average of 6.2 million viewers per broadcast — a 32% increase over the prior year. The Vikings-Browns game at Tottenham Hotspur Stadium drew 6.4 million viewers, the highest NFL Network figure ever recorded for a London fixture. Wembley's Rams-Jaguars matchup packed in 86,152 spectators, the highest attendance of the 2025 International Series. These are not just football numbers — they are betting market accelerants. Every eyeball watching a London Game is a potential new bettor discovering NFL wagering for the first time.
What makes the UK NFL betting market structurally different from its American counterpart is the regulatory environment. UK bettors operate under the UK Gambling Commission framework, which means licensed operators, mandatory responsible-gambling tools, and recent affordability-check thresholds that trigger enhanced due diligence when net losses exceed certain levels. That regulatory backbone provides consumer protections that simply do not exist in much of the US market. It also means UK sportsbooks must be UKGC-licensed to legally offer NFL markets to British residents — a requirement that filters out unregulated offshore operators.
The 95% of UK online bets placed from home, with 76% of 18-24 year olds using mobile devices, paints a clear picture of how the market functions. NFL betting in Britain is a mobile-first, app-driven activity — Sunday evenings on the sofa, Thursday night streams on a phone, Super Bowl parties with a sportsbook open in another tab. That behaviour pattern is important because it shapes which bet types gain traction. Quick, accessible markets like anytime touchdown scorer and match result dominate mobile interfaces, which partly explains the 90% surge in player prop staking.
Integrity, Regulation, and the Future of NFL Wagering
Here is the uncomfortable truth about the NFL's relationship with sports betting: the league earns roughly $1 billion from its sportsbook partnerships, which run on five-year cycles initiated in 2021, while simultaneously lobbying to restrict the very products that drive the most betting revenue. That tension — profit from gambling, but control its risks — is the defining story of NFL wagering regulation right now.
In November 2025, the NFL circulated an internal memorandum targeting prop bets, describing their "corrosive effect" on the sport. The memo pushed for tighter restrictions on player-level proposition markets — the same bet type that has driven explosive growth in both US and UK markets. The league's position reflects genuine integrity concerns: when bettors can wager on whether a specific quarterback throws for over 250 yards, the incentive structure around individual performance changes in ways that traditional spread or moneyline bets do not create.
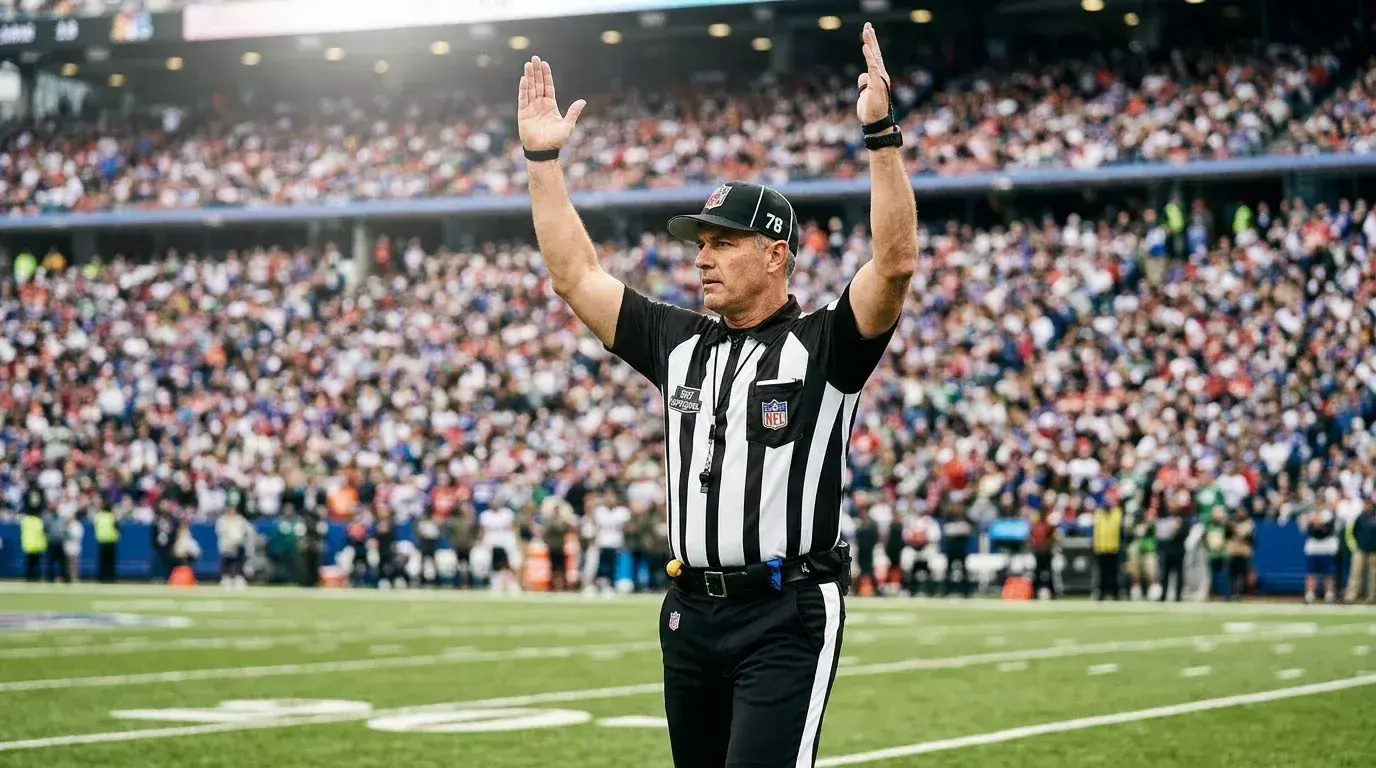
The integrity debate did not emerge from a vacuum. In 2023, ten NFL players were suspended for violating the league's gambling policy — an unprecedented wave that exposed how close the betting ecosystem had come to the locker room. Since that crackdown, no further player suspensions have been recorded, which the league interprets as evidence that enforcement works. Critics argue it simply means the problem went underground.
Jeff Miller, the NFL's executive vice president, has been particularly vocal about prediction markets — platforms like Kalshi and Polymarket that allow users to wager on NFL outcomes without the regulatory guardrails that govern licensed sportsbooks. "We are particularly troubled that several sports-related futures contracts have been launched nationwide, including in jurisdictions where sports betting has not been legalized," Miller stated. His concern is not abstract: prediction markets operate outside state gaming commissions, outside the integrity-monitoring agreements the NFL has with its official sportsbook partners, and outside the responsible-gambling frameworks that UK regulators require.
For British bettors, the integrity question lands differently than it does in the US. The UKGC framework already mandates robust integrity monitoring, suspicious-betting alerts, and operator cooperation with sports governing bodies. The newer affordability checks — triggered when a customer's net losses exceed certain thresholds within a rolling period — add another layer of oversight that has no equivalent in most American jurisdictions. Whether those checks are proportionate or overly intrusive is a live debate in the UK gambling industry, but their existence means British NFL bettors operate in a market where the regulatory floor is meaningfully higher than what American bettors experience in many states.
The future of NFL wagering will be shaped by how these tensions resolve. The league wants the revenue. The public wants the products. The regulators want the guardrails. And the data — handle growth, prop-bet volume, integrity incidents — will be the terrain on which those competing interests negotiate. If you bet on the NFL from the UK, staying informed about the regulatory landscape is not optional reading. It is part of understanding the market you are in.
How We Source and Verify NFL Betting Data
Nine years of tracking NFL betting data has made me obsessive about sourcing. Every number on this page comes from a verifiable primary source — not from a tipster's Telegram channel, not from an anonymous forum post, and not from a secondary aggregator that may have misquoted the original.
Primary sources used across this data hub include: the American Gaming Association (AGA) for US handle and market data; individual state gaming commission filings for handle and revenue breakdowns; SEC filings from publicly traded operators such as Flutter Entertainment, Genius Sports, and Entain for financial disclosures; the UK Gambling Commission for British market data, regulatory thresholds, and demographic statistics; NFL.com and NBC Sports for viewership and attendance figures; and specialist industry publications that cite named, auditable data points. Where a statistic cannot be traced to a named institutional source, it does not appear on this page.
ATS records and spread results are sourced from historical odds databases that track closing lines and final scores across every NFL regular-season and playoff game. I cross-reference these against multiple trackers to catch discrepancies — different sources occasionally disagree on push outcomes, which can shift a team's ATS record by a game or two depending on how they treat line movement. The figures reported here reflect the most widely accepted closing-line consensus.
Market projections — such as global betting market valuations and compound annual growth rate forecasts — come from named research firms including Grand View Research, SkyQuest Technology, and Technavio. These are estimates, not observed data, and I flag them as such. A projection is useful for understanding directional trends, but it is not the same thing as a gaming-commission filing that reports actual money wagered. I keep the two categories distinct throughout this hub, and I would encourage you to do the same in your own analysis.
FAQ
How much money is bet on the NFL each season?
Americans wagered approximately $30 billion on the NFL through legal sportsbooks during the 2025 season, representing an 8.5% increase from the prior year. That figure covers regulated US operators only and does not include offshore, international, or peer-to-peer wagering. When you add global markets — including the UK, where NFL betting volume grew by 60% year-on-year — the true worldwide NFL handle is substantially higher, though no single source aggregates it precisely. The NFL generates more betting handle per unit of time than any other sport in the United States, with a single regular-season Sunday routinely outpacing an entire week of action from other major leagues.
What is the most profitable NFL betting strategy based on historical data?
No single NFL betting strategy has been consistently profitable across all seasons without exception. However, historical data highlights several angles with persistent edges over large samples. Backing underdogs against the spread has produced cover rates above 50% in most seasons, with the 2025 season seeing underdogs finish 89-69-4 ATS. Fading heavy public consensus — taking the contrarian side when 75% or more of handle lands on one team — has shown marginal long-term value. The critical caveat is that any strategy must be evaluated net of the bookmaker's margin, which averages 10.15% hold rate across US sportsbooks. A "profitable" angle needs to clear that structural edge to deliver actual returns, and very few approaches manage it consistently over multiple seasons.
Do NFL underdogs cover the spread more often than favourites?
Over the long run, NFL underdogs cover the spread at rates that hover near 50%, which is what you would expect from an efficient market. In individual seasons, the split can tilt significantly. The 2025 season was a striking example: underdogs covered at a 56.3% rate (89-69-4 ATS), one of the strongest underdog seasons in recent memory. Home teams, traditionally given a points advantage in the spread, covered at just 43% — continuing a post-COVID erosion of home-field edge. The year-to-year variance means that "always back the dog" is not a reliable strategy, but the data consistently shows that underdogs outperform casual bettor expectations more often than most people realise.
How do NFL London games affect betting markets and odds?
NFL London games create unique market dynamics because they eliminate traditional home-field advantage. Both teams are effectively on the road, travel fatigue affects squads differently depending on bye-week scheduling and roster depth, and the UK fanbase introduces a different demand profile into the market. Staking on London Games grew 51% in 2025 compared to the prior year, reflecting surging UK interest. From a line-setting perspective, bookmakers tend to tighten spreads in London games — the neutral-site factor removes the standard 1-to-3-point home adjustment — which means the margin between favourite and underdog is smaller than a typical regular-season game. For UK bettors, London Games represent both a high-engagement event and a genuinely distinct betting environment.
What are the key numbers in NFL point spread betting?
The most important key numbers in NFL spreads are 3 and 7. More games are decided by exactly three points (a field goal) than any other margin, making the difference between +3 and +2.5 enormously significant over a season of bets. Seven points (a touchdown plus extra point) is the second most common margin. After that, 10 and 6 appear with meaningful frequency. These numbers matter because they define where pushes, covers, and losses cluster. A bettor who consistently gets the better side of a key number — taking +3 instead of +2.5, or -6.5 instead of -7 — gains a small but compounding edge over hundreds of wagers.
How does same game parlay profitability compare to single bets?
Same game parlays carry a substantially higher house edge than single bets or even traditional multi-game parlays. The reason is correlation: legs within a single game influence each other (a team winning is correlated with that team's players hitting statistical milestones), and sportsbooks price that correlation using proprietary models that embed additional margin on each leg. A two-leg SGP typically has a win probability around 49-52%, but the payout offered is generally lower than the true-odds equivalent. As you add legs, the win probability drops sharply — below 30% at three legs, below 15% at four — while the embedded margin compounds. The 2024/25 NFL season was a rare outlier where SGP outcomes swung heavily in bettors' favour, but that was driven by an unusually high favourite-win rate that the models did not anticipate. Over multi-season samples, SGPs are among the most profitable products for sportsbooks.
Is it legal to bet on the NFL in the UK?
Yes. Betting on the NFL is fully legal in the United Kingdom for anyone aged 18 or over, provided you use a sportsbook licensed by the UK Gambling Commission. All major UK operators offer NFL markets, including spread (handicap), moneyline (match result), totals (over/under), and player props. UK bettors pay no direct tax on gambling winnings — the tax obligation falls on the operator, not the customer. The UKGC requires licensed operators to implement responsible-gambling tools including deposit limits, self-exclusion options, and affordability checks that are triggered when net losses exceed specified thresholds. These consumer protections make the UK one of the most regulated sports betting environments in the world.