
NFL Odds Didn’t Always Look the Way They Do Now
I keep a spreadsheet of NFL closing lines dating back to 2003, and scrolling through it from start to finish is like watching a market evolve in time-lapse. The earliest entries feature wider spreads, less granular totals, and a pricing structure that looks almost quaint compared to today’s razor-thin margins. Before the Supreme Court struck down PASPA in 2018, Americans wagered less than $5 billion on all sports annually through legal channels. By 2024, that figure had approached $150 billion. That thirty-fold expansion did not just change the volume of NFL betting — it fundamentally reshaped how odds are made, distributed, and consumed.
Understanding the history of NFL odds is not an academic exercise. It explains why the lines you see today are sharper than they have ever been, why finding value is harder than it was a decade ago, and why the tools and strategies that worked in the pre-legalisation era need updating for the current market.
The Pre-PASPA Era: Limited Markets, Wider Margins
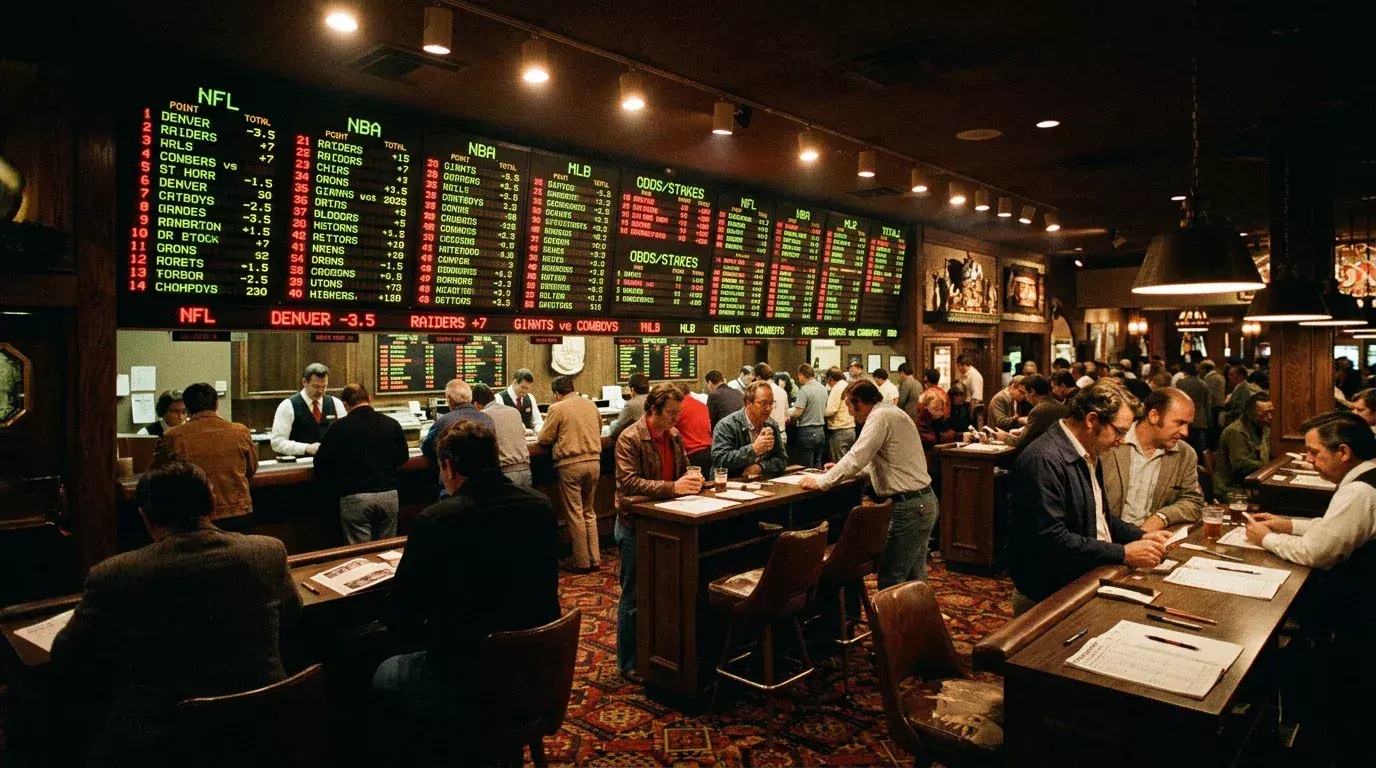
Before 2018, legal NFL betting in the United States was effectively confined to Nevada. A handful of sportsbooks in Las Vegas set the lines, and those lines propagated outward to offshore operators and international books with varying degrees of fidelity. The UK market priced NFL games independently through its own odds compilers, but with far less liquidity than domestic US markets, which meant wider margins and slower line movement.
The defining feature of pre-PASPA NFL odds was the vig structure. The standard -110 on both sides of a spread bet was nearly universal, producing a theoretical hold of 4.55%. There was minimal competition to reduce that number because bettors had few alternatives. If you wanted to bet NFL legally in the US, you went to Vegas or you used an offshore account with no regulatory protection. Neither environment incentivised sportsbooks to compress margins.
Totals markets were even less competitive. Many pre-PASPA sportsbooks offered only full-number totals — 42, 43, 44 — without half-point options, which created a higher push rate and effectively increased the house edge. Player prop markets barely existed outside of the Super Bowl. The breadth of NFL betting that we take for granted today — hundreds of markets per game, in-play wagering, same game parlays — was simply not available.
Post-Legalisation: How Competition Compressed the Vig
PASPA’s repeal did not just open new markets. It introduced competition on a scale the industry had never experienced. Within three years of the ruling, more than twenty states had launched legal sports betting, and dozens of operators were competing for the same customers. That competition manifested directly in the odds.
The most visible change was the emergence of reduced-vig pricing. Operators began offering -105 or even -108 on select NFL spreads as promotional tools to attract new accounts. Some built their entire brand around low-margin pricing. The theoretical hold on a -105/-105 spread market drops to 2.44%, nearly half of the traditional -110 structure. Even operators that maintained -110 as their standard began offering odds boosts, profit boosts, and other promotional mechanisms that effectively reduced the vig on individual bets.
Mark Locke, CEO of Genius Sports, captured the industry’s trajectory in 2025 when discussing the company’s expanded partnership with the NFL. His confidence in long-term margin expansion and cash flow growth reflected a market where data, technology, and competition were compressing the vig on standard markets while creating new high-margin products — like SGPs and microbetting — to replace the lost revenue. The net effect for bettors: better prices on traditional markets, worse implied odds on the exotic products that generate the most excitement.
The total US sports betting gross gaming revenue reached $16.80 billion in 2025 on a handle of $165.58 billion, producing a hold rate of 10.15%. That hold is higher than what the compressed vig on spread markets alone would predict, and the reason is product mix. Traditional spread and moneyline bets hold 5%—7%. The growing share of parlays, props, and SGPs pulls the blended hold rate upward, masking the fact that informed bettors now have access to fairer pricing on core markets than at any point in the sport’s betting history.
Average Spread and Totals Trends by Era
The average NFL closing spread has compressed over the past two decades, reflecting both improved competitive balance in the league and more efficient market pricing. In the mid-2000s, it was common to see seven or eight games per week with spreads of seven points or more. By the 2020s, the average closing spread had drifted lower, with most games falling in the 2.5-to-6.5 range and double-digit spreads appearing only a handful of times per season.
Totals have moved in the opposite direction. The average NFL game total has climbed from roughly 41—42 points in the early 2000s to 44—46 in recent seasons, tracking the league’s shift toward pass-heavy offences. Rule changes designed to protect quarterbacks and receivers have inflated scoring, and the totals market has followed. This long-term upward drift means that bettors using historical totals data from the pre-2015 era are working with baselines that no longer apply to the current scoring environment.
For UK bettors, the practical implication is that NFL odds are now set in a deeply competitive, data-rich environment. The soft lines and wide margins that characterised the pre-PASPA era are gone in the US market, and UK sportsbooks — while still carrying slightly wider overrounds on NFL markets — have been forced to sharpen their pricing to remain competitive with US-facing operators accessible to internationally mobile bettors. The detailed spread mechanics analysis explores how these structural changes affect key-number pricing and cover rates at the game level.