
The Twenty Yards That Decide Most Bets
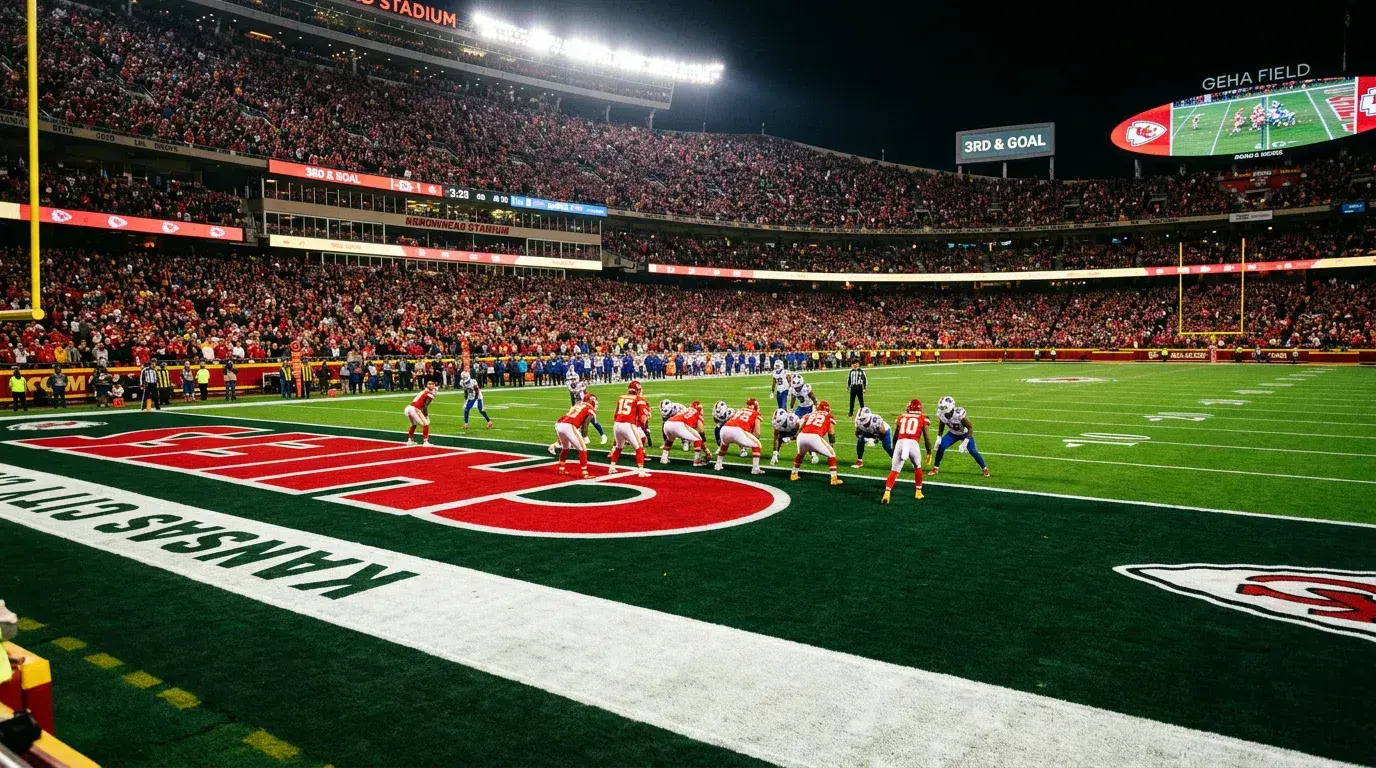
Every NFL game is decided in the red zone. I know that sounds reductive — there are 100 yards of football field, after all — but the data is unambiguous. Teams that convert red-zone trips into touchdowns at high rates win more games, cover more spreads, and push totals over at higher rates than teams that settle for field goals. The difference between a touchdown and a field goal is four points. Over the course of four or five red-zone trips per game, that gap compounds into the margin that separates a cover from a loss.
The NFL average red-zone touchdown conversion rate has hovered between 55% and 60% over the past five seasons. That range might look stable, but the variance between individual teams is enormous. In any given season, the best red-zone offence converts at 70%—75%, while the worst sits near 45%. That 25-percentage-point gap translates to roughly one extra touchdown per game — a seven-point swing that the betting line frequently underweights.
See also: NFL first scorer markets linked to red zone data.
How Red Zone Efficiency Drives Totals Markets
The connection between red-zone efficiency and game totals is direct and measurable. When two teams with above-average red-zone touchdown rates meet, the game is structurally likely to produce more points than the total suggests. The reverse holds for matchups between two teams that settle for field goals inside the 20 — those games trend toward lower-scoring outcomes regardless of how much total yardage the offences generate.
I have run this analysis across every NFL season since 2019, and the pattern is consistent. Games where both teams rank in the top ten in red-zone TD percentage have gone over the posted total at approximately 56%—57%. Games where both teams rank in the bottom ten have gone under at a similar rate. The market sets totals primarily based on yards-per-play efficiency, pace of play, and defensive adjusted rankings. Red-zone conversion rate is baked in to some extent, but not fully — because red-zone performance is noisier than between-the-20s performance and oddsmakers weight the more stable metrics more heavily.
This creates a persistent angle. If you track red-zone TD rates as a standalone input alongside your other totals factors, you gain an edge in games where red-zone performance diverges sharply from overall offensive and defensive metrics. A team that ranks fifteenth in total offence but fifth in red-zone TD rate is more dangerous to the total than its overall ranking suggests.
Red Zone Defence and Its ATS Implications
Red-zone defence is the overlooked sibling. Everyone tracks red-zone offence because it is exciting — touchdowns make highlight reels, field goals do not. But red-zone defence — the ability to force field-goal attempts instead of surrendering touchdowns — has a stronger correlation with ATS performance than red-zone offence does.
A team that holds opponents to a 48% red-zone TD rate instead of the league average 57% is saving roughly four points per game relative to an average defence. That four-point swing is enormous in a sport where the average margin of victory is 10—11 points. Over the 2025 season, the five teams with the best red-zone TD defence all finished with winning ATS records. Not every season produces a perfect correlation, but the direction is reliable enough to incorporate into a betting model.
The practical application is in matchup analysis. When a potent red-zone offence meets a stingy red-zone defence, the market tends to give the offence the benefit of the doubt because offensive metrics receive more public attention. This creates a subtle bias toward overs and favourites in these matchups that does not always reflect the actual scoring environment. Sportsbooks processed $16.80 billion in gross gaming revenue in 2025 from that $165.58 billion in handle, and red-zone inefficiency — the gap between expected and actual scoring — contributes meaningfully to that house profit.
Goal-Line Situations and First-Half Scoring Patterns
Narrowing the lens from the 20-yard red zone to the 5-yard goal-line area reveals even more pronounced tendencies. Goal-line offence is a different sport from between-the-20s offence. It rewards power running, tight-end blocking, and quarterback sneaks rather than the route-running and pass-protection skills that dominate outside the red zone. Teams with heavy offensive lines and physical running backs convert inside the 5 at significantly higher rates than teams built around finesse passing concepts.
This has direct first-half betting implications. First-half totals are set as a percentage of the full-game total, typically around 46%—48% of the full-game number. But goal-line efficiency does not distribute evenly across halves. Teams with strong goal-line packages tend to score more efficiently in the first half, when scripted plays and fresh legs favour power concepts. The second half, when defences adjust and fatigue sets in, produces more stalled drives and field goals. If you can identify a goal-line efficiency edge in the first half, first-half overs become a targeted play.
See also: nfl betting statistics — red zone stats.
Using Red Zone Data to Sharpen NFL Spread Bets
Red-zone data is not a standalone betting system. It is a lens for refining spread analysis. When I evaluate a spread bet, I run through the standard checklist — injuries, rest, matchup advantages, weather — and then overlay red-zone efficiency as a final filter. If my model favours a team by 4 points but that team ranks 28th in red-zone TD rate, I reduce my confidence in the cover because red-zone failures turn touchdowns into field goals and erode projected margins.
The reverse is equally useful. A team priced as a 3-point underdog that ranks in the top five in red-zone offence has a structural advantage the market may not fully price. Every drive that reaches the 20 has a higher probability of producing a touchdown, which narrows the scoring gap against a favoured team that struggles to convert inside the red zone. This filter is particularly relevant in spread betting analysis, where key numbers like 3 and 7 make the difference between covering and falling short by half a score.
The data is freely available. Every major NFL statistics aggregator publishes weekly red-zone efficiency rankings. Incorporating this data into your handicapping requires minimal additional effort and produces a meaningful refinement to both totals and spread analysis across the entire season.