
The Invisible Variable That Moves the Scoreboard
In Week 11 of the 2024 season, I had an under bet on a game projected at 44.5 points. Both defences were stout, both offences were methodical and run-heavy, and the weather forecast called for 15-mph crosswinds. Everything pointed to a low-scoring game. Then I saw the referee assignment: a crew that had averaged 48.3 points per game across their first ten assignments that season. My stomach dropped. The game finished 27-24. The over cashed by 6.5 points, and the difference was twelve penalties for 98 yards — more than double the season average.
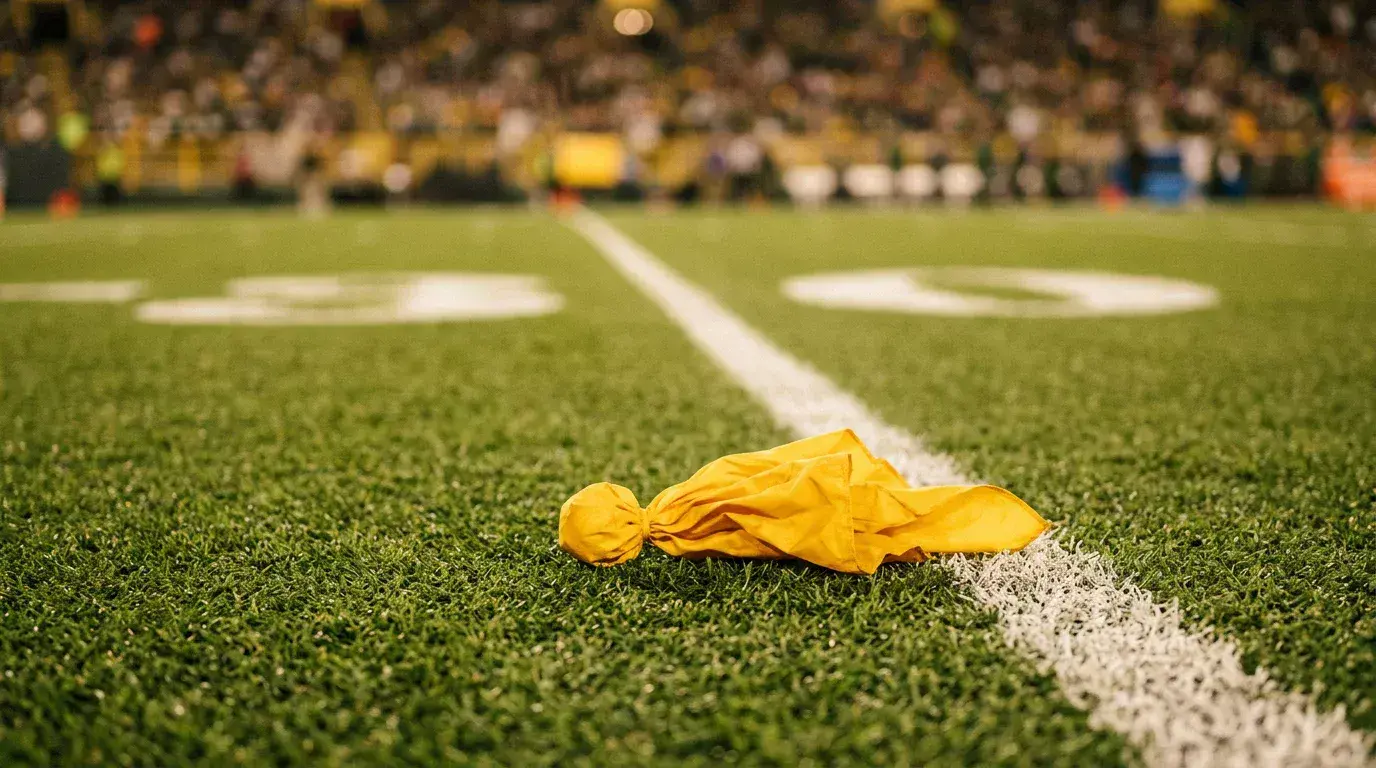
Referee tendencies are the most overlooked variable in NFL totals betting. Every bettor analyses offensive and defensive efficiency, weather, pace of play, and rest. Very few check the referee assignment, which is published each week and carries measurable impact on game flow, penalty frequency, and scoring output.
See also: NFL totals data for over/under analysis.
Measuring Officiating Impact on Points Scored
The NFL employs 17 officiating crews, each led by a head referee. These crews officiate the same set of rules, but they enforce them at different rates. The variance is not subtle. In any given season, the highest-scoring crew’s games average 3—5 points more per game than the lowest-scoring crew’s games. That gap is significant in a market where totals are priced to the half-point.
The mechanism is penalty frequency and type. Crews that flag more defensive holding and pass-interference penalties extend offensive drives that would otherwise have ended. Each additional first-down penalty extends a drive by an average of 2.5 plays and produces approximately 0.7 additional expected points. A crew that averages two more defensive penalties per game than the league mean is adding 1.4 expected points to the game total — a figure that the totals market does not consistently account for.
Conversely, crews that flag more offensive penalties — holding, false starts, illegal formation — suppress scoring by stalling drives and pushing offences into unfavourable down-and-distance situations. These crews’ games trend toward unders at elevated rates, and the effect is most pronounced in indoor games where weather cannot be blamed for the scoring suppression.
Pass Interference Calls and the Big-Play Effect
Defensive pass interference is the single most impactful penalty in the NFL because it is enforced at the spot of the foul. A 40-yard DPI call moves the offence from midfield to inside the 10-yard line in a single play, creating a near-certain scoring opportunity from what was an incomplete pass. Crews vary dramatically in their DPI call rates — some flag it four to five times per game, others flag it once or twice. That variance produces a direct effect on scoring that the totals market captures imperfectly.
I track DPI rates by crew across the season and weight this data when evaluating totals. A game between two pass-heavy offences officiated by a high-DPI crew is structurally more likely to produce points than the offensive and defensive efficiency metrics alone would predict. The effect stacks: pass-heavy offences create more opportunities for DPI, and a lenient crew converts more of those opportunities into yardage and scoring chances.
This analysis connects directly to the broader scoring environment. The total US handle reached $165.58 billion in 2025, and totals markets account for a significant portion of that volume. Sportsbooks set totals based on team metrics, venue, and weather — but they do not publish referee-adjusted totals. The adjustment is left to the bettor, which is exactly where the edge exists for those willing to do the work.
Penalty Flags and Spread Implications
Referee tendencies affect spreads less directly than totals, but the impact is real in specific game types. When an undisciplined team — one that commits penalties at an above-average rate — draws a tight-calling crew, the penalty count can spiral. A team that averages eight penalties per game might commit twelve or thirteen against a strict crew, and those additional penalties often produce drive-killing false starts and holdings that suppress scoring and narrow the margin of victory.
The 2025 regular season saw the public go 145-140 ATS, a near-even split that reflects an efficient market overall. Within that aggregate, games officiated by the three strictest penalty crews showed a slight lean toward underdogs covering, because the increased penalty volume disrupted the offensive flow of favoured teams more than their opponents. Favourites rely on sustained drives and clock management; penalties break that rhythm. Underdogs rely on turnovers and explosive plays; penalties have less impact on high-variance strategies.
See also: nfl betting statistics — referee tendencies.
Building Referee Data into a Weekly Handicapping Process
The NFL publishes referee assignments each Tuesday, giving bettors five days to incorporate the information before Sunday kickoff. The data needed is straightforward: total points per game by crew, penalties per game by type, and the over/under record for each crew’s assignments that season. Several freely available databases track this information in real time.
My process is simple. After completing my standard totals analysis for each game, I check the referee assignment and apply a correction factor. If the crew’s games are running 2+ points above the league average in total scoring, I add a point to my projected total. If the crew is running 2+ points below, I subtract. This correction changes my position on approximately three to four totals per week — flipping a lean from under to over, or vice versa, based on the officiating variable that most bettors ignore.
The edge is not enormous. Referee-informed totals adjustments improve my totals win rate by approximately 1.5%—2% over a full season, which translates to a handful of additional wins across 250+ totals evaluations. But in a market where the hold rate sits at 10.15% across the full US handle — reflecting how thin margins are for bettors — every percentage point of additional accuracy matters. The over/under statistics and trends provide the baseline against which referee adjustments are most effectively measured, and combining both approaches produces a totals framework that accounts for variables the market treats as noise.